Fil:Carbon cycle-cute diagram.svg
Spring til navigation
Spring til søgning

Størrelse på denne PNG forhåndsvisning af denne SVG-fil: 600 × 460 pixels. Andre opløsninger: 313 × 240 pixels | 626 × 480 pixels | 1.002 × 768 pixels | 1.280 × 981 pixels | 2.560 × 1.963 pixels.
Oprindelig fil (SVG fil, basisstørrelse 600 × 460 pixels, filstørrelse: 65 KB)
Beskrivelse
| Beskrivelse |
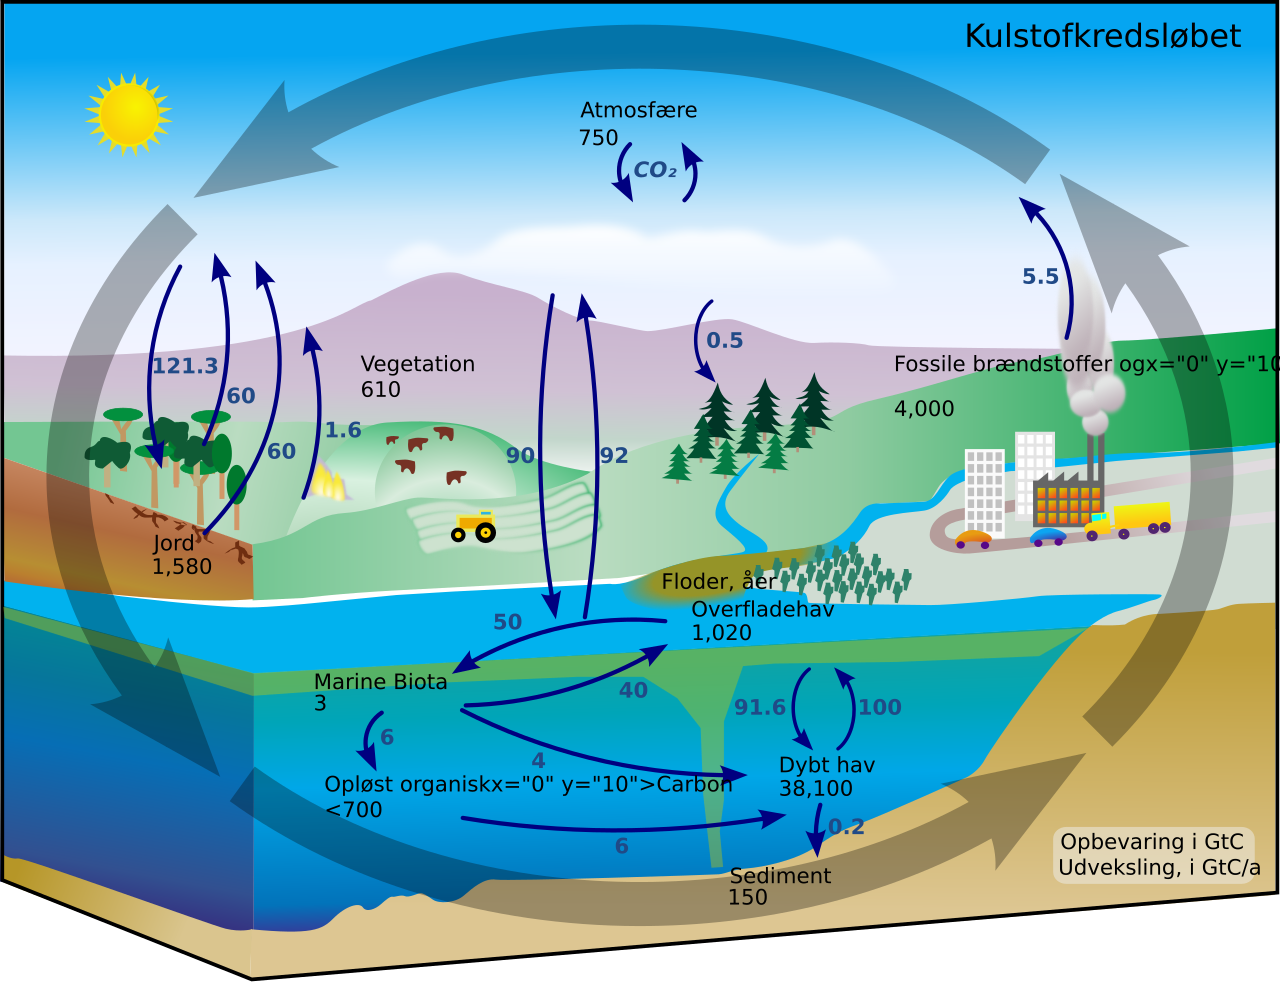
Deutsch: Diagramm des Kohlenstoffkreislaufes. Die schwarzen Zahlen zeigen wie viele Milliarden Tonnen Kohlenstoff (Gt C) in den verschiedenen Resevoiren vorhanden sind. Die blauen Zahlen zeigen an, wie viel Kohlenstoff zwischen den einzelnen Speichern pro Jahr ausgetauscht wird.
English: This carbon cycle diagram shows the storage and annual exchange of carbon between the atmosphere, hydrosphere and geosphere in gigatons - or billions of tons - of Carbon (GtC). Burning fossil fuels by people adds about 5.5 GtC of carbon per year into the atmosphere.
Español: Este esquema del ciclo del carbono muestra el almacenamiento y los cambios anuales del s entre la atmósfera, la hidrósfera y la geósfera en gigatones, o miles de millones de toneladas, de carbono (GtC). La quema de combustibles fósiles libera cerca de 5.5 mil millones de toneladas de carbono al año en la atmósfera.
Galego: Este esquema do ciclo do carbono amosa o almacenamento e os cambios anuais do carbono entre a atmosfera, a hidrosfera e a xeosfera en xigatóns, ou miles de millóns de toneladas, de carbono (XtC). A queima de combustibles fósiles libera preto de 5.5 mil millóns de toneladas de carbono ó ano na atmosfera.
日本語: 炭素循環の概念図。黒の数値はそれぞれのリザーバーに存在する炭素量、青の数値はリザーバー間での年間の炭素の移動量。単位はギガt(10億トン)
Русский: Схема геохимического цикла углерода показывает количество углерода в атмосфере, гидросфере и геосфере Земли, а также годовой перенос углерода между ними. Все величины приведены в гигатоннах (миллиардах тонн). В результате сжигания ископаемого топлива, человечество ежегодно добавляет 5,5 гигатонн углерода в атмосферу. |
||
| Dato | |||
| Kilde | Own work based on: Carbon cycle-cute diagram.jpeg (i.e. https://earthobservatory.nasa.gov/features/CarbonCycle) | ||
| Forfatter |
Vektor: |
||
| Tilladelse (Genbrug af denne fil) |
|
||
| Andre versioner |
File:Carbon cycle-cute diagram.svg has 18 embedded translations.
[]
|
||
| SVG udvikling | switch elements: all translations are stored in the same file. |


Oprindelig oplægningslog
This image is a derivative work of the following images:
- File:Carbon cycle-cute diagram.jpeg licensed with PD-USGov-NASA, PD-USGov-NASA/copyright
- 2006-09-12T15:16:24Z Giac83 540x417 (53453 Bytes) {{Information| |Description= This [[:en:carbon cycle]] diagram shows the storage and yearly changes of the carbon between the [[:en:Earth's atmosphere|atmosphere]], [[:en:hydrosphere]] and [[:en:geosphere]] in Gigatons - or b
Uploaded with derivativeFX
Filhistorik
Klik på en dato/tid for at se filen som den så ud på det tidspunkt.
| Dato/tid | Miniaturebillede | Dimensioner | Bruger | Kommentar | |
|---|---|---|---|---|---|
| nuværende | 1. apr. 2024, 21:26 | | 600 × 460 (65 KB) | wikimediacommons>Pko | Reverted to version as of 10:00, 8 September 2021 (UTC) |
Filanvendelse
Den følgende side bruger denne fil: