Fil:Cauchy sequence illustration.png
Spring til navigation
Spring til søgning
Størrelse af denne forhåndsvisning: 800 × 560 pixels. Andre opløsninger: 320 × 224 pixels | 640 × 448 pixels | 1.024 × 717 pixels | 1.280 × 896 pixels | 2.706 × 1.894 pixels.
Oprindelig fil (2.706 × 1.894 billedpunkter, filstørrelse: 76 KB, MIME-type: image/png)
Beskrivelse
| Beskrivelse |
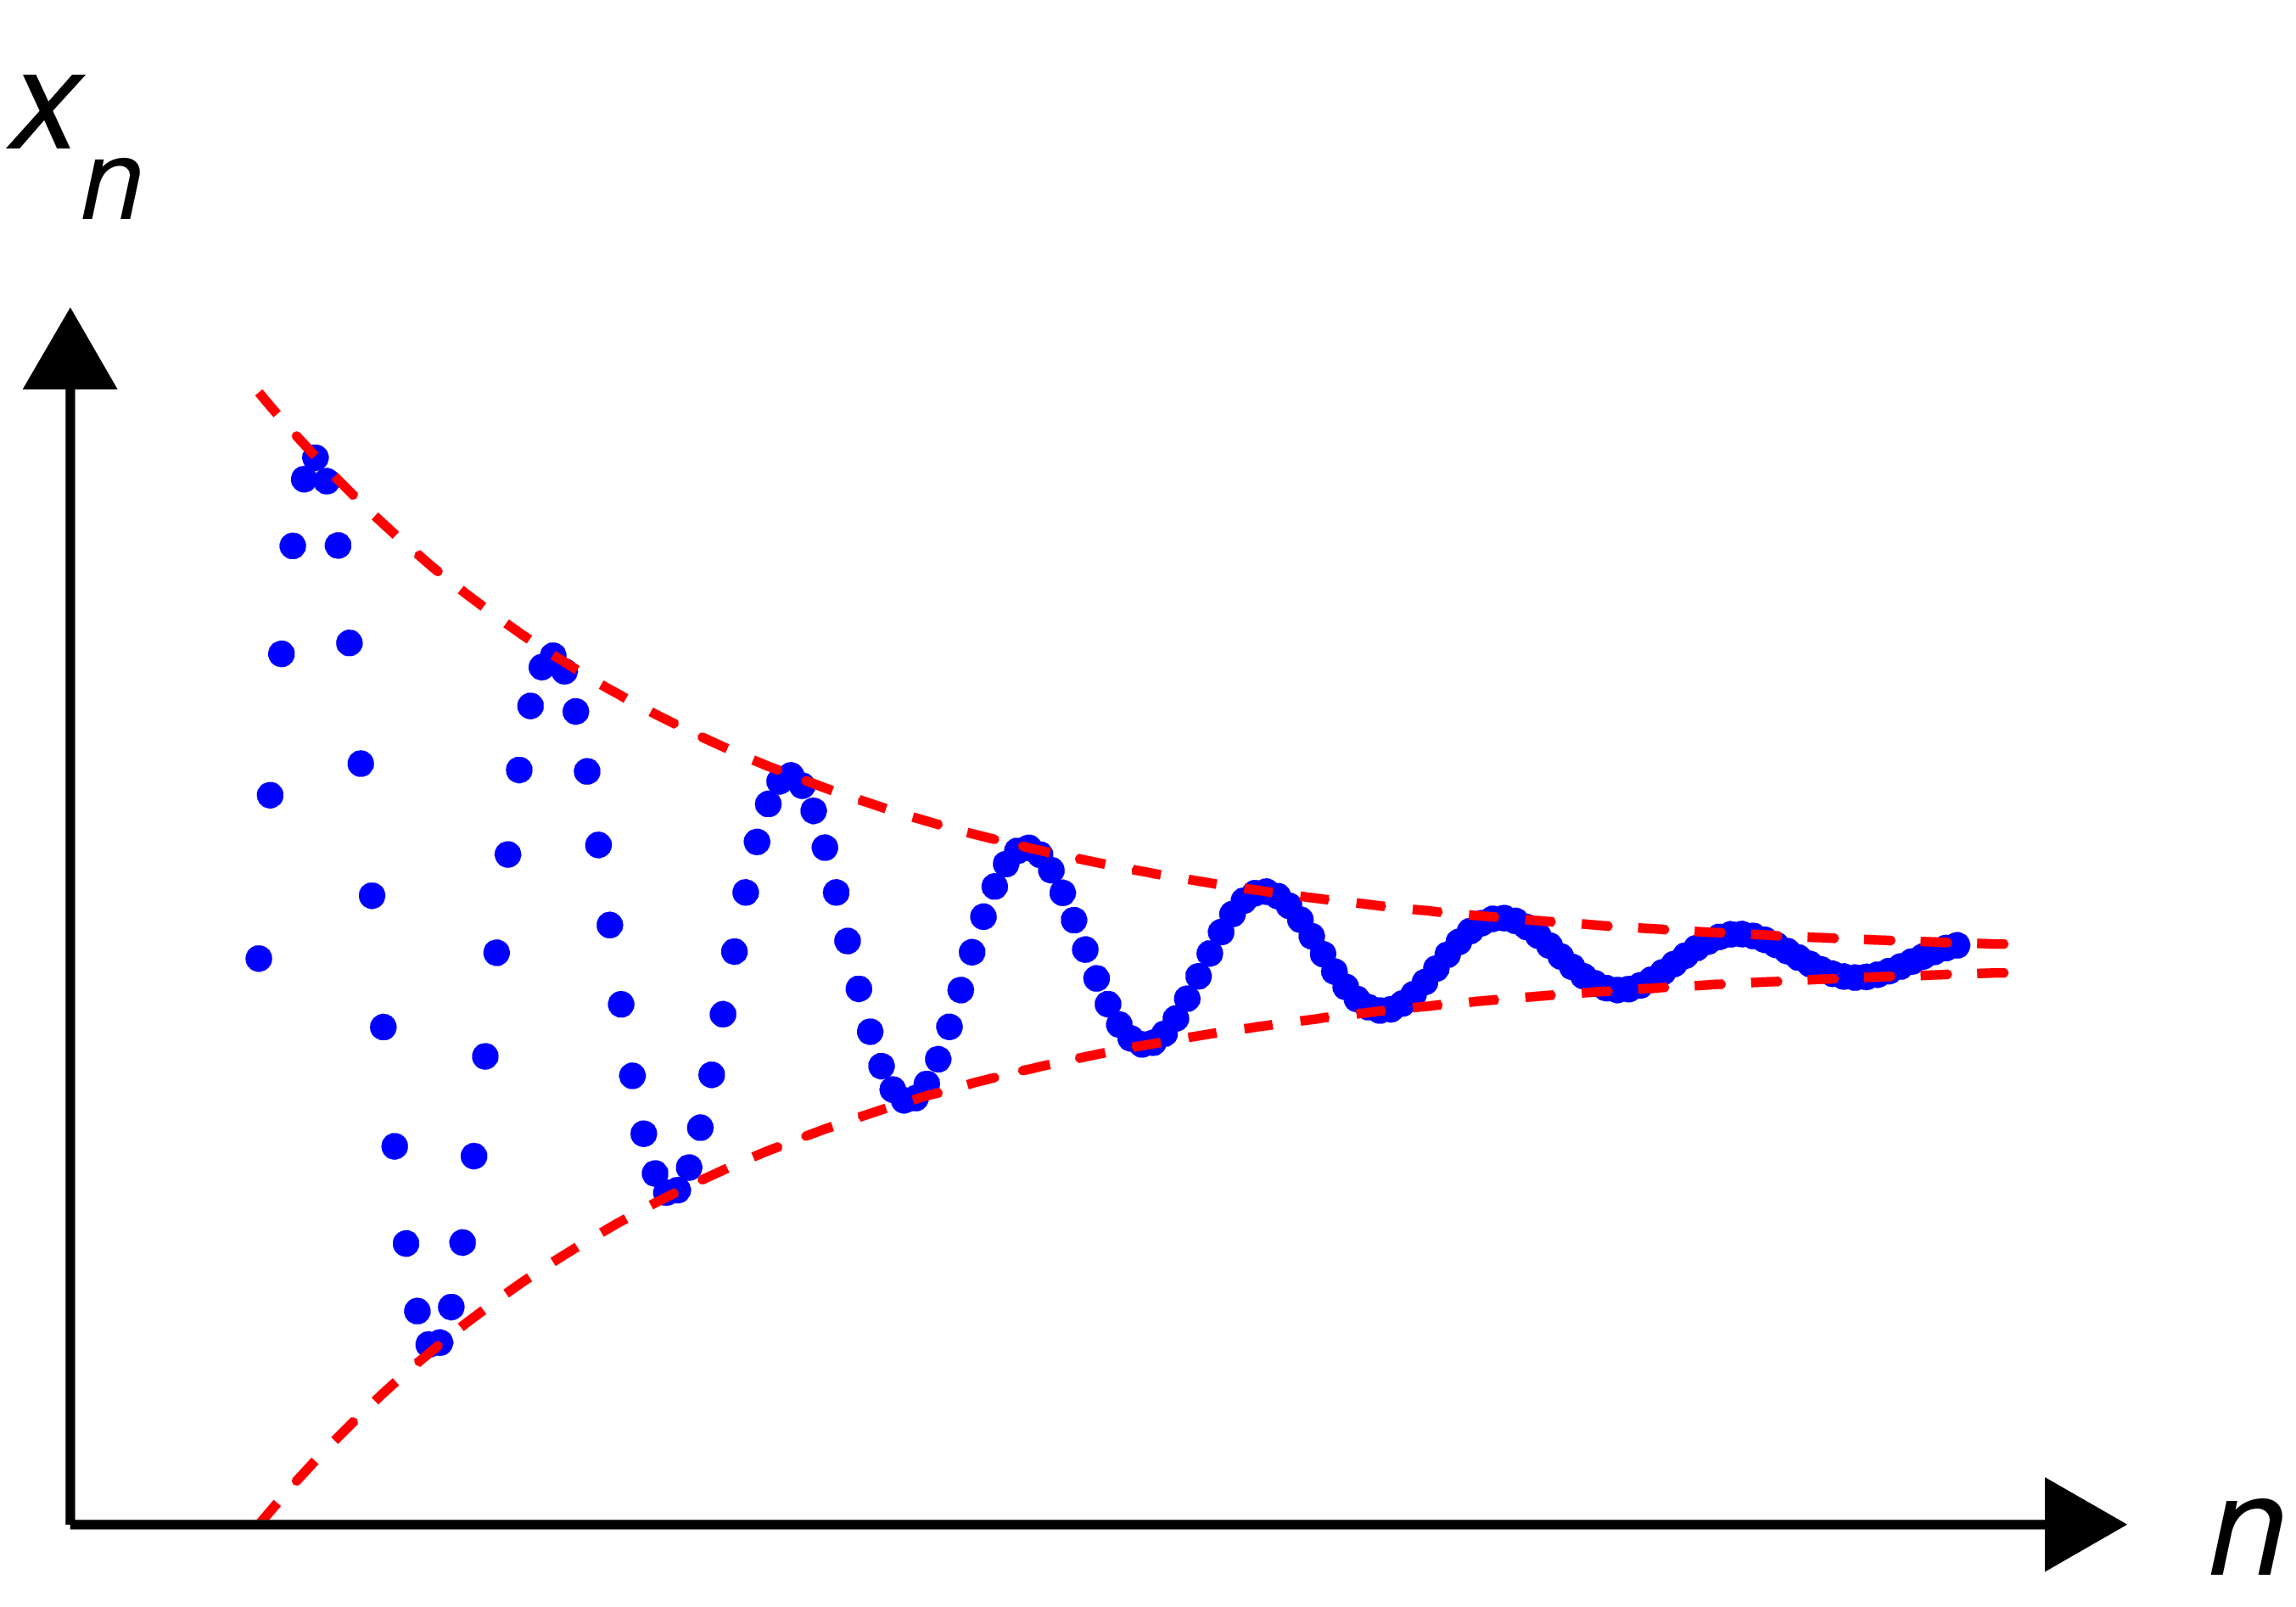
English: Illustration of Cauchy sequence. |
|||
| Dato | ||||
| Kilde | Eget arbejde | |||
| Forfatter | Oleg Alexandrov | |||
| Andre versioner |
|
|||
| PNG udvikling | ||||
| Kildekode | MATLAB code% draw an illustration of a Cauchy sequence
function main()
% prepare the screen and define some parameters
figure(1); clf; hold on; axis equal; axis off;
fontsize=30; thick_line=3; thin_line=2;
black=[0, 0, 0]; red=[1, 0, 0]; blue=[0, 0, 1];
arrowsize=0.5; arrow_type=1; arrow_angle=30; % (angle in degrees)
circrad=0.07; % radius of ball showing up in places
B=9;
X=0:0.06:B;
f=inline('3*exp(-0.4*X)', 'X');
Y=sin(5*X).*f(X);
for i=1:length(X)
ball(X(i), Y(i), circrad, blue);
end
X=0:0.05:(B+0.3);
Z=f(X);
plot(X, Z, 'r--', 'linewidth', thin_line)
plot(X, -Z, 'r--', 'linewidth', thin_line)
% draw the coordinate axes
shift=-3;
Kx=1.1; Ky=1.3;
L=max(Y);
arrow([-1 shift], [Kx*B, shift], thin_line, arrowsize, arrow_angle, arrow_type, black)
arrow([-1, shift], [-1, Ky*L], thin_line, arrowsize, arrow_angle, arrow_type, black)
text(Kx*B+0.6, shift, '\it{n}', 'fontsize', fontsize, 'HorizontalAlignment', 'c')
text(-1, Ky*L+0.8, '\it{x_n}', 'fontsize', fontsize, 'HorizontalAlignment', 'c')
% save to disk
saveas(gcf, 'Cauchy_sequence_illustration.eps', 'psc2') % export to eps
function ball(x, y, r, color)
Theta=0:0.1:2*pi;
X=r*cos(Theta)+x;
Y=r*sin(Theta)+y;
H=fill(X, Y, color);
set(H, 'EdgeColor', 'none');
function arrow(start, stop, th, arrow_size, sharpness, arrow_type, color)
% Function arguments:
% start, stop: start and end coordinates of arrow, vectors of size 2
% th: thickness of arrow stick
% arrow_size: the size of the two sides of the angle in this picture ->
% sharpness: angle between the arrow stick and arrow side, in degrees
% arrow_type: 1 for filled arrow, otherwise the arrow will be just two segments
% color: arrow color, a vector of length three with values in [0, 1]
% convert to complex numbers
i=sqrt(-1);
start=start(1)+i*start(2); stop=stop(1)+i*stop(2);
rotate_angle=exp(i*pi*sharpness/180);
% points making up the arrow tip (besides the "stop" point)
point1 = stop - (arrow_size*rotate_angle)*(stop-start)/abs(stop-start);
point2 = stop - (arrow_size/rotate_angle)*(stop-start)/abs(stop-start);
if arrow_type==1 % filled arrow
% plot the stick, but not till the end, looks bad
t=0.5*arrow_size*cos(pi*sharpness/180)/abs(stop-start); stop1=t*start+(1-t)*stop;
plot(real([start, stop1]), imag([start, stop1]), 'LineWidth', th, 'Color', color);
% fill the arrow
H=fill(real([stop, point1, point2]), imag([stop, point1, point2]), color);
set(H, 'EdgeColor', 'none')
else % two-segment arrow
plot(real([start, stop]), imag([start, stop]), 'LineWidth', th, 'Color', color);
plot(real([stop, point1]), imag([stop, point1]), 'LineWidth', th, 'Color', color);
plot(real([stop, point2]), imag([stop, point2]), 'LineWidth', th, 'Color', color);
end
|


Licensering
| Jeg, indehaveren af ophavsretten til dette værk, udgiver dette værk som offentlig ejendom. Dette gælder i hele verden. I nogle lande er dette ikke juridisk muligt. I så fald: Jeg giver enhver ret til at anvende dette værk til ethvert formål, uden nogen restriktioner, medmindre sådanne restriktioner er påkrævede ved lov. |
Filhistorik
Klik på en dato/tid for at se filen som den så ud på det tidspunkt.
| Dato/tid | Miniaturebillede | Dimensioner | Bruger | Kommentar | |
|---|---|---|---|---|---|
| nuværende | 3. jun. 2007, 22:08 | | 2.706 × 1.894 (76 KB) | wikimediacommons>Oleg Alexandrov | Tweak fonts and resolution. |
Filanvendelse
Den følgende side bruger denne fil: